


HIGH POINT, N.C., Nov. 5, 2018 – A High Point University Poll finds that North Carolina’s registered voters are split in their votes and intended votes for U.S. Congress, as well as the North Carolina House of Representatives and Senate.
The most recent HPU Poll included registered voters who had already voted in the 2018 elections, as well as those who had not yet voted. When asked about their choices for U.S. Congress, 43 percent of these registered voters say they voted or were more likely to vote for the Republican Party’s candidate if the election were held today, 45 percent say they voted or were more likely to vote for the Democratic Party’s candidate and 2 percent say they voted or would vote for a Libertarian Party candidate if one were on the ballot. Of the registered voters who had not yet voted, 8 percent say they did not know or were unsure for whom they would vote and did not lean toward a particular party.
When asked about their choices for North Carolina Senate, registered voters gave very similar responses about the votes they already had cast or intended to cast. In all, 43 percent of these registered voters say they voted or would vote for the Republican Party’s candidate if the election were held today, 45 percent say they voted or would vote for the Democratic Party’s candidate, and 2 percent say they voted or would vote for a Libertarian Party candidate if one were on the ballot. Of the registered voters who had not yet voted, 8 percent say they did not know or were unsure for whom they would vote and did not lean toward a particular party.
When asked about their choices for North Carolina House of Representatives, 42 percent of these registered voters say they voted or would vote for the Republican Party’s candidate if the election were held today, 46 percent say they voted or would vote for the Democratic Party’s candidate, and 3 percent say they voted or would vote for a Libertarian Party candidate if one were on the ballot. Of the registered voters who had not yet voted, 9 percent say they did not know or were unsure for whom they would vote and did not lean toward a particular party.
Registered voters also give President Donald Trump a job approval rating of 42 percent, and 50 percent say that the country is on the wrong track.
“As we head into the 2018 mid-term election, the HPU Poll spoke to North Carolinians who have already voted and registered voters who had not yet filled in a ballot,” says Brian McDonald, associate director of the HPU Poll and adjunct instructor of survey research methods. “Our poll shows that voters are split on how they voted or will vote, and what registered voters told us about their view of the president and the direction of the country may play into their decision on how to cast their ballot on Election Day.”
Self-Identified Registered Voters – Direction of the Country (October 2018)
Do you think things in this country are generally going in the right direction or do you feel things have gotten pretty seriously off on the wrong track?
Right direction – 39 percent
Wrong track – 50 percent
Don’t know/refuse – 11 percent
(Self-identified registered voter (North Carolina resident) phone and online sample, surveyed Oct. 26 – Nov. 1, 2018, n = 680 and credibility interval of +/- 4.6 percent)
Self-Identified Registered Voters – Presidential Job Approval (October 2018)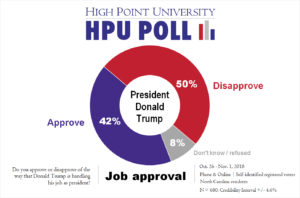
Do you approve or disapprove of the way that Donald Trump is handling his job as president?
Approve – 42 percent
Disapprove – 50 percent
Don’t know/Refuse – 8 percent
(Self-identified registered voter (North Carolina resident) phone and online sample, surveyed Oct. 26 – Nov. 1, 2018, n = 680 and credibility interval of +/- 4.6 percent)
Self-Identified Registered Voters – Generic Ballot – U.S. Congress (October 2018)
Registered Voters: If the elections for U.S. Congress were being held TODAY, would you vote for the Republican Party’s candidate OR the Democratic Party’s candidate for Congress in your district?
OR
Already Voted: In the election for U.S. Congress, did you vote for the Republican Party’s candidate, the Democratic Party’s candidate or someone else for Congress in your district?
[PARTY TOTALS INCLUDE UNDECIDEDS LEANING TOWARD A PARTICULAR PARTY]
Republican Candidate – 43 percent
Democratic Candidate – 45 percent
Libertarian Candidate – 2 percent
Other – 2 percent
Don’t know/Undecided/Refuse – 8 percent
(Self-identified registered voter (North Carolina resident) phone and online sample, surveyed Oct. 26 – Nov. 1, 2018, n = 680 and credibility interval of +/- 4.6 percent)
Self-Identified Registered Voters – Generic Ballot – N.C. House of Representatives (October 2018)
Registered Voters: If the elections for the North Carolina House of Representatives were being held TODAY, would you vote for the Republican Party’s candidate OR the Democratic Party’s candidate for Congress in your district?
OR
Already Voted: In the election for North Carolina House of Representatives, did you vote for the Republican Party’s candidate, the Democratic Party’s candidate or someone else for Congress in your district?
[PARTY TOTALS INCLUDE UNDECIDEDS LEANING TOWARD A PARTICULAR PARTY]
Republican Candidate – 42 percent
Democratic Candidate – 46 percent
Libertarian Candidate – 3 percent
Other – 2 percent
Don’t know/Undecided/Refuse – 9 percent
(Self-identified registered voter (North Carolina resident) phone and online sample, surveyed Oct. 26 – Nov. 1, 2018, n = 680 and credibility interval of +/- 4.6 percent)
Self-Identified Registered Voters – Generic Ballot – N.C. Senate (October 2018)
Registered Voters: If the elections for the North Carolina Senate were being held TODAY, would you vote for the Republican Party’s candidate OR the Democratic Party’s candidate for Congress in your district?
OR
Already Voted: In the election for North Carolina Senate, did you vote for the Republican Party’s candidate, the Democratic Party’s candidate or someone else for Congress in your district?
[PARTY TOTALS INCLUDE UNDECIDEDS LEANING TOWARD A PARTICULAR PARTY]
Republican Candidate – 43 percent
Democratic Candidate – 45 percent
Libertarian Candidate – 2 percent
Other – 2 percent
Don’t know/Undecided/Refuse – 8 percent
(Self-identified registered voter (North Carolina resident) phone and online sample, surveyed Oct. 26 – Nov. 1, 2018, n = 680 and credibility interval of +/- 4.6 percent)
The most recent HPU Poll was fielded by live interviewers at the High Point University Survey Research Center calling on Oct. 26-Nov. 1, 2018 and an online survey fielded at the same time. The responses from a sample of all North Carolina counties came from 680 adults interviewed online (433 respondents) as well as landline or cellular telephones (247 respondents). The Survey Research Center contracted with Survey Sampling International to acquire these samples, and fielded the online survey using its Qualtrics platform. This is a combined sample of live phone interviews and online interviews. The online sampling is from a panel of respondents, so their participation does not adhere to usual assumptions associated with random selection. Therefore, it is not appropriate to assign a classical margin of sampling error for the results. In this case, the SRC provides a credibility interval of plus or minus 4.1 percentage points to account for a traditional 95 percent confidence interval for the estimates (plus or minus 3.4 percentage points) and a design effect of 1.2 (based on the weighting). The data is weighted toward population estimates for age, gender, race, and education level based on U.S. Census numbers for North Carolina. Factors such as question wording and other methodological choices in conducting survey research can introduce additional error into the findings of opinion polls. Details from this survey are available at http://www.highpoint.edu/src/files/2018/11/62memoA.pdf.
Further results and methodological details from the most recent survey and past studies can be found at the Survey Research Center website at http://www.highpoint.edu/src/. The materials online include past press releases as well as memos summarizing the findings (including approval ratings) for each poll since 2010.
The HPU Poll reports methodological details in accordance with the standards set out by AAPOR’s Transparency Initiative, and the HPU Survey Research Center is a Charter Member of the Initiative. For more information, see http://transparency.aapor.org/index.php/transparency.
You can follow the HPU Poll on Twitter at https://twitter.com/HPUSurveyCenter.
Dr. Martin Kifer, chair and associate professor of political science, serves as the director of the HPU Poll and Brian McDonald is the associate director of the HPU Poll.