HIGH POINT, N.C., Nov. 23, 2016 – The new High Point University and News and Record post-election survey finds North Carolinians relatively confident in the 2016 election results, but pessimistic about future relations between the major political parties, dissatisfied with their available presidential choices, and somewhat open to voting for a third party in 2020.
A majority of North Carolina residents (51 percent) said that they have a lot of confidence that the 2016 election results accurately reflect the votes cast while a quarter of respondents (26 percent) said they had some confidence in the results. About one out of five (21 percent) said they had no confidence in the results.
In contrast to relatively high confidence in the election results, North Carolinians were not particularly satisfied with the choices of candidates they had in the 2016 presidential election. Nearly half of respondents (47 percent) said they were not at all satisfied with their choices while only 12 percent said they were very satisfied. Forty percent expressed some satisfaction with the overall choices.
“These findings are consistent with what we have been seeing elsewhere in terms of dissatisfaction with the choices presented to voters and the election overall,” says Brian McDonald, associate director of the HPU Poll and adjunct professor. “Voters express confidence in how the election process operated, but did not particularly like the candidates the party system produced.”
A majority of North Carolina residents (58 percent) said they think Republicans and Democrats in Washington will spend more time next year working against each other rather than together.
This dissatisfaction and pessimism is accompanied by an expressed willingness to consider third party candidates in 2020, the next presidential election year. A majority of North Carolinians (55 percent) said that they would consider voting for a third party candidate in 2020. If they could choose a third party candidate, nearly half (47 percent) would prefer someone more moderate than the other major party choices, while almost a third (32 percent) would want a conservative choice, and 13 percent would like a more liberal choice.
“A sizable fraction of voters often express some support for third party options, but rarely do many people end up voting for those additional choices,” says Martin Kifer, director of the HPU Poll and associate professor of political science. “It remains to be seen whether this dissatisfaction with politics as usual will translate into more support for third party candidates in the future.”
All adults – Republicans and Democrats in Washington (November 2016)
Do you think Republicans and Democrats in Washington will spend more time next year working against each other or working together to get things done?
Working against each other – 58 percent
Working together – 35 percent
(Don’t know/refuse) – 8 percent
(All adult (North Carolina residents) sample surveyed November 12-17, n = 481 and margin of sampling error approximately = +/- 4.5 percent)
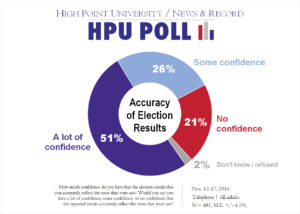 All adults – Confidence in Election Results (November 2016)
How much confidence do you have that the election results this year accurately reflect the votes that were cast? Would you say you have a lot of confidence, some confidence, or no confidence that the reported results accurately reflect the votes that were cast?
A lot of confidence – 51 percent
Some confidence– 26 percent
No confidence – 21 percent
(Don’t know) – 2 percent
(All adult (North Carolina residents) sample surveyed November 12-17, n = 481 and margin of sampling error approximately = +/- 4.5 percent)
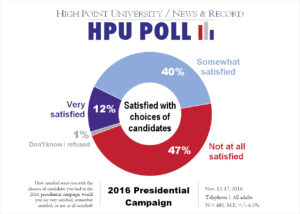 All adults – Satisfaction with 2016 Presidential Candidates (November 2016)
How satisfied were you with the choices of candidates you had in the 2016 presidential campaign, would you say very satisfied, somewhat satisfied, or not at all satisfied?
Very satisfied – 12 percent
Somewhat satisfied – 40 percent
Not at all satisfied – 47 percent
(Don’t know) – 1 percent
(All adult (North Carolina residents) sample surveyed November 12-17, n = 481 and margin of sampling error approximately = +/- 4.5 percent)
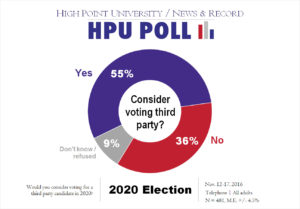 All adults – Considering Third Party Candidates (November 2016)
Would you consider voting for a third party candidate in 2020?
Yes – 55 percent
No – 36 percent
(Don’t know/Refuse) – 9 percent
(All adult (North Carolina residents) sample surveyed November 12-17, n = 481 and margin of sampling error approximately = +/- 4.5 percent)
All adults – Preferred Third Party Candidate Ideology (November 2016)
If you could choose an ideal third party candidate for the 2020 presidential campaign, would you prefer to have a candidate in the race who was more liberal, more conservative, or more moderate than all the major party candidates?
More liberal – 13 percent
More conservative – 32 percent
More moderate – 47 percent
(Don’t know/Refuse) – 9 percent
(All adult (North Carolina residents) sample surveyed November 12-17, n = 481 and margin of sampling error approximately = +/- 4.5 percent)
The most recent HPU Poll was fielded by live interviewers at the High Point University Survey Research Center calling on Nov. 12 – 17, 2016. The responses from a sample of all North Carolina counties came from 481 adults with landline or cellular telephones. The Survey Research Center contracted with Survey Sampling International to acquire this sample. The survey has an estimated margin of sampling error of approximately 4.5 percentage points for all adult respondents. That margin of error is 4.8 percentage points for the sample of respondents who said they voted on November 8, 2016. The data is weighted toward population estimates for cellular and landline telephone use, age, gender and race. In addition to sampling error, factors such as question wording and other methodological choices in conducting survey research can introduce additional error into the findings of opinion polls. Details from this survey are available at http://www.highpoint.edu/src/files/2016/11/49memoB.pdf.
Further results and methodological details from the most recent survey and past studies can be found at the Survey Research Center website at http://www.highpoint.edu/src/. The materials online include past press releases as well as memos summarizing the findings (including approval ratings) for each poll since 2010.
The HPU Poll reports methodological details in accordance with the standards set out by AAPOR’s Transparency Initiative, and the HPU Survey Research Center is a Charter Member of the Initiative. For more information, see http://transparency.aapor.org/index.php/transparency.
You can follow the HPU Poll on Twitter at https://twitter.com/HPUSurveyCenter. Dr. Martin Kifer, associate professor of political science, serves as the director of the HPU Poll, and Brian McDonald serves as the associate director of the HPU Poll.