HPU Poll: 61% of North Carolinians Say They Will Spend Less Than $100 This Halloween
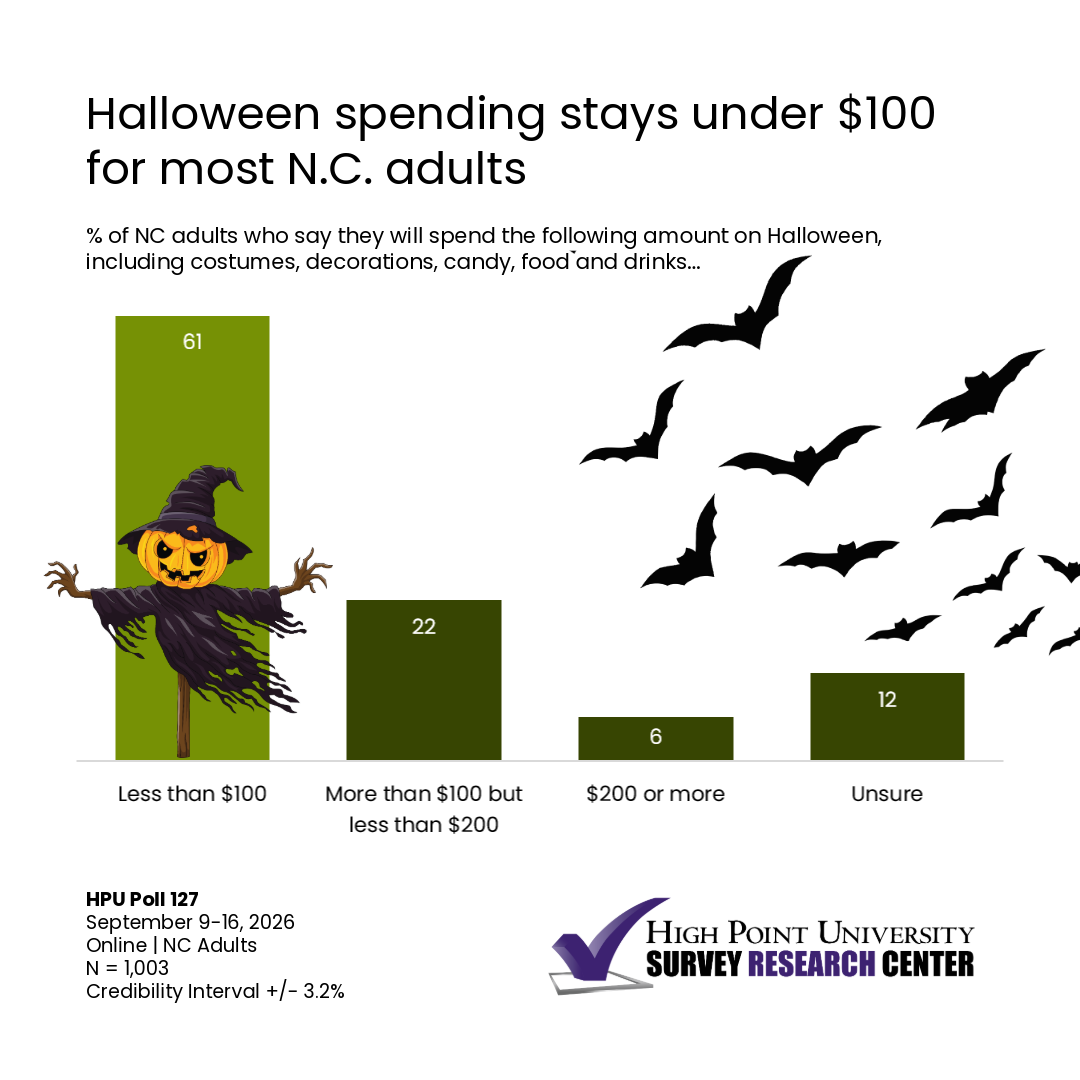
HIGH POINT, N.C., Oct. 23, 2026 – A High Point University Poll finds about three-fifths of North Carolinians (61%) say they will spend less than $100 on Halloween, including costumes, decorations, candy to give out and food and drinks.
While 28% say they will spend more than $100 on Halloween, three-fifths of the respondents (59%) say their expenditures will be about the same as last year. Only 19% say they will spend less on Halloween than a year ago, and 15% say they will pay more.
The poll asks respondents which candies they have favorable or unfavorable views on. More than three-quarters say they had a favorable opinion of M&M’s (83%), Kit Kats (82%), Snickers (80%), Hershey Bars (80%), Reese’s Cups (79%), and Twix (75%).
More than half of those North Carolinians surveyed feel favorably towards Butterfinger (69%), Skittles (69%), Tootsie Rolls (67%), Whoppers (59%), Smarties (59%), candy corn (57%), Nerds (55%), and Sour Patch Kids (53%).
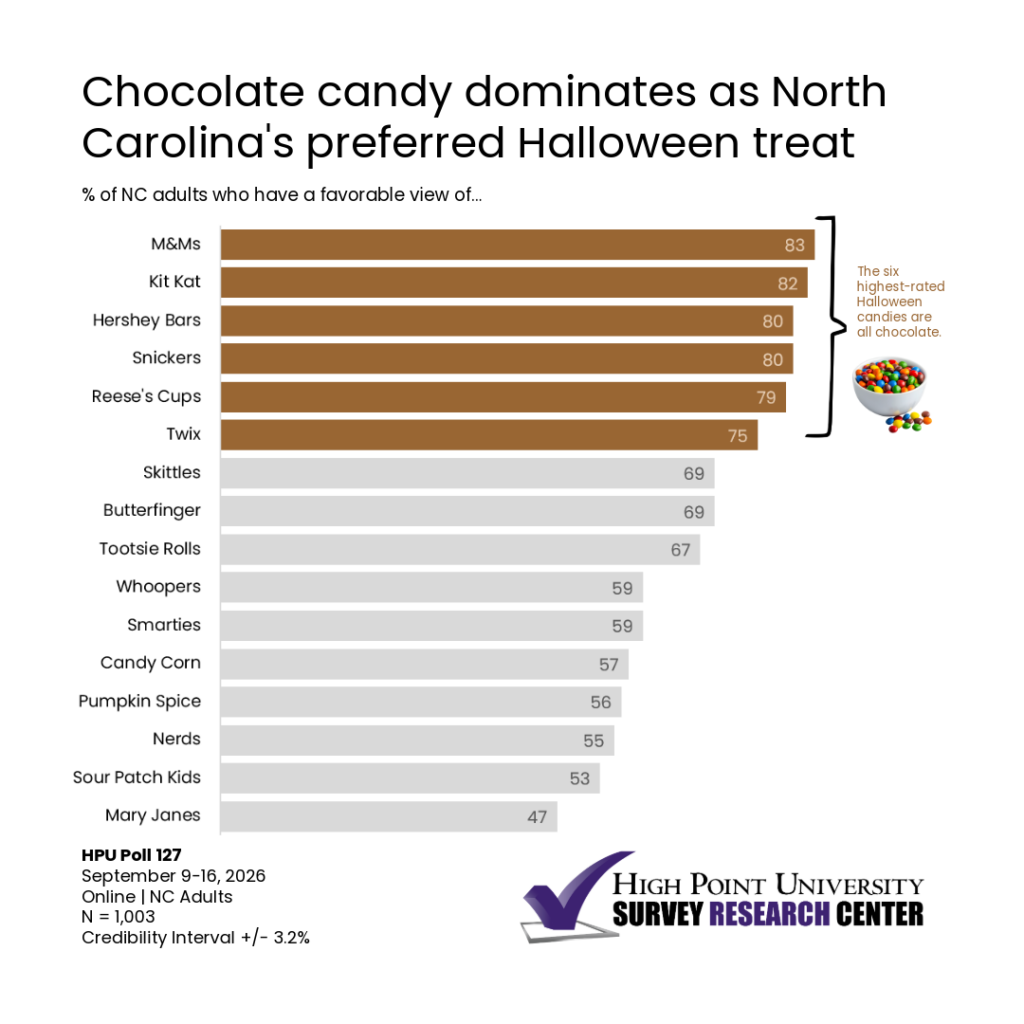
A majority of respondents also have a favorable opinion of pumpkin spice (56%). This is a reversal from last year when HPU Poll 113 found a majority (53%) had an unfavorable view of the flavor. Only 47% of North Carolinians favor Mary Janes, the candy with orange-and-black wrapping and a taste like peanut butter.
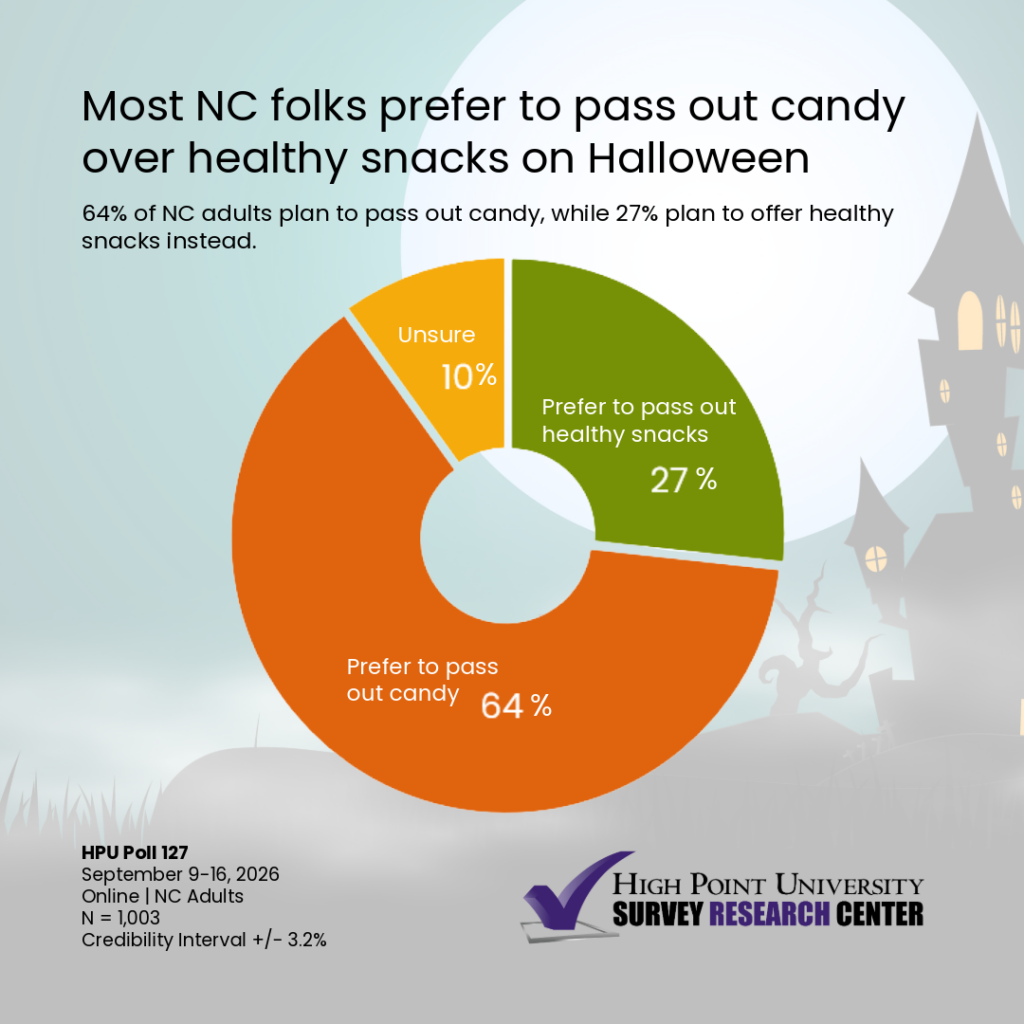
Candy distribution was preferred to giving out snacks, as only about one quarter (27%) of these North Carolinians say they will pass out healthy snacks instead of candy to children trick-or-treating at their house.
Only about one in five (22%) of North Carolina residents say they will dress a pet in a costume.
Halloween 2026 – Question Wordings and Responses – North Carolina Residents
(September 2026)
Some people spend a lot of time and money celebrating the Halloween holiday, others do not celebrate much at all. Altogether how much money would you say you will spend this year on Halloween, including things like costumes, decorations, candy to give out, and food and drinks?
Less than $100 – 61%
More than $100 but less than $200 – 22%
$200 or more – 6%
Unsure – 12%
Would you say that is more or less than last year?
More – 15%
About the same – 59%
Less – 19%
Unsure – 6%
| Please indicate whether you plan to do each of the following to celebrate Halloween, or not? (Items were presented in a randomized order) | |||
| Yes | No | Unsure | |
| Watch a scary movie | 53 | 38 | 8 |
| Pass out candy to children trick-or-treating at your house | 51 | 41 | 9 |
| Display Halloween decorations in your home or yard | 49 | 43 | 8 |
| Carve a pumpkin | 42 | 49 | 9 |
| Wear a costume | 34 | 57 | 9 |
| Dress your children in costumes | 34 | 60 | 6 |
| Take children trick-or-treating | 33 | 60 | 7 |
| Attend a Halloween party | 31 | 57 | 12 |
| Pass out healthy snacks instead of candy to children trick-or-treating at your house | 27 | 64 | 10 |
| Dress up a pet in a costume | 22 | 70 | 8 |
| Please indicate whether you have [favorable or unfavorable] view of each of items listed below. (Candies were presented in randomized order) | |||
| Favorable | Unfavorable | Unsure/Not familiar with this person or thing | |
| M&Ms | 83 | 12 | 5 |
| Kit Kat | 82 | 14 | 4 |
| Snickers | 80 | 16 | 4 |
| Hershey bars | 80 | 16 | 4 |
| Reese’s Cups | 79 | 16 | 5 |
| Twix | 75 | 20 | 5 |
| Butterfinger | 69 | 25 | 6 |
| Skittles | 69 | 26 | 5 |
| Tootsie Rolls | 67 | 27 | 6 |
| Whoppers | 59 | 31 | 10 |
| Smarties | 59 | 31 | 10 |
| Candy corn | 57 | 37 | 6 |
| Pumpkin spice | 56 | 35 | 9 |
| Nerds | 55 | 37 | 9 |
| Sour Patch Kids | 53 | 39 | 7 |
| Mary Janes (that candy that is in orange and black wrapping and tastes kind of like peanut butter) | 47 | 37 | 17 |
Methodology:
The High Point University Survey Research Center (SRC) fielded HPU Poll 127 from Sept. 9 through Sept. 16, as an online survey using a panel of respondents recruited and maintained by Dynata. Dynata sent invitations to its panel of North Carolina respondents, and the SRC collected 1,003 responses from adults age 18 and older living in North Carolina using its Qualtrics platform. All interviews were conducted in English.
The SRC conducted all data analysis. The online sample is from a non-probability panel of respondents, so it is not appropriate to assign a classic margin of sampling error to the results. For the full all-adults sample (n = 1,003), the SRC provides a credibility interval of plus or minus 3.2 percentage points to account for a traditional 95% confidence interval for the estimates (plus or minus 3.1 percentage points) and a design effect of 1.1 based on the weighting.
HPU’s SRC worked with Dynata to fill quotas for age, gender, race and ethnicity based on estimates within the North Carolina adult population derived from U.S. Census reports. The all-adults data is weighted toward population parameters for age, gender, race, education and ethnicity published by the U.S. Census for North Carolina. The High Point University Survey Research Center produces weights through an iterative procedure within SPSS. Weights are based on demographic variables. Factors such as question wording and other methodological choices in conducting survey research can introduce additional error into the findings of opinion polls.
HPU Polls include at least one CAPTCHA and reCAPTCHA for screening out non-human respondents in addition to the screening done by Dynata. To enhance data quality, the survey included two response quality items that screened out respondents who did not answer them correctly.
The HPU SRC drafted the survey instrument, which was approved by the HPU Institutional Review Board. Interviews were collected through the High Point University® SRC, recording responses in Qualtrics. Dynata’s online panels invited respondents. Respondents were compensated according to their agreements with Dynata.
The HPU SRC did not use AI for generating responses, interviewing, cleaning data, producing estimates or coding/labeling data.
Further results and methodological details from the most recent survey and past surveys can be found at the Survey Research Center website. Materials online include past press releases as well as memos summarizing the findings for each poll since 2010.
The HPU Poll reports methodological details in accordance with the standards set out by AAPOR’s Transparency Initiative, and the HPU Survey Research Center is a Charter Member of the Initiative.
Dr. Martin Kifer, chair and professor of political science, serves as executive director of the HPU Poll for the Survey Research Center. Dr. J.R. Moller serves as staff director of the HPU Poll for the Survey Research Center. Tiffany Medford serves as program coordinator for the Survey Research Center.