HPU Poll: Pumpkin Pie is Favorite Holiday Pie in North Carolina and Nationally
In the latest High Point University Poll, more United States residents (28%) and North Carolinians (23%) chose pumpkin pie as their favorite pie to eat during the holidays than any other type of pie.
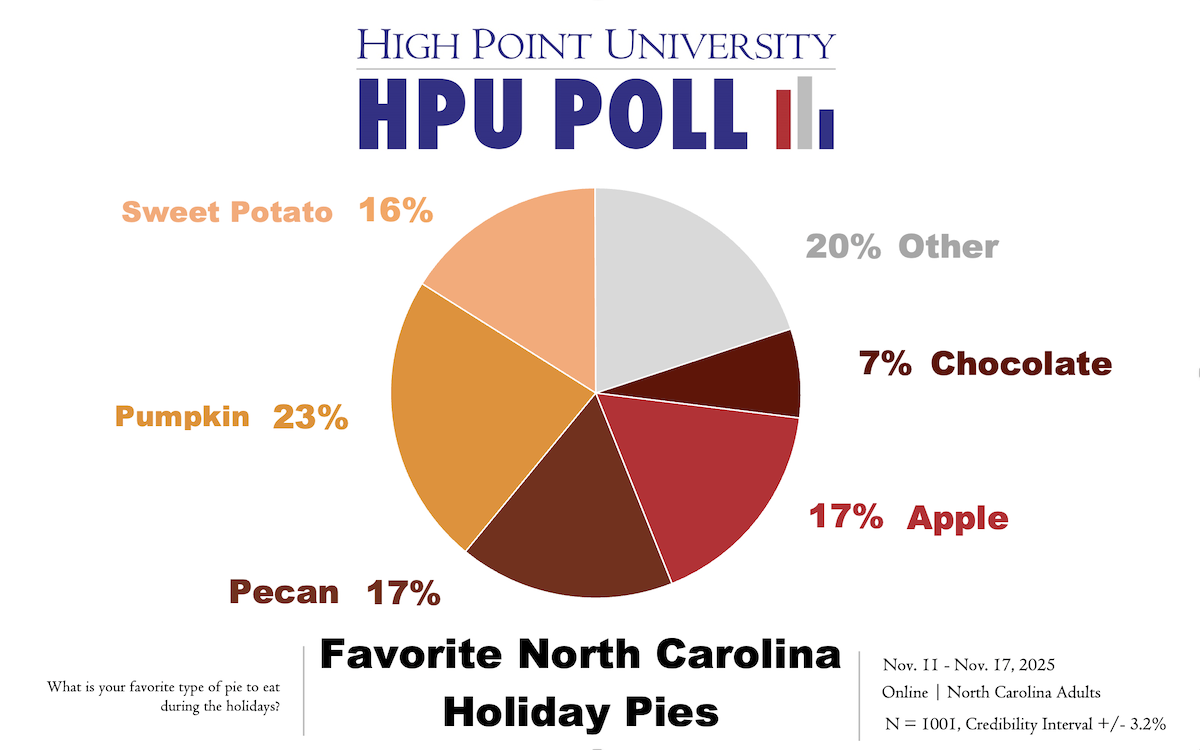
HIGH POINT, N.C., Nov. 25, 2025 – In the latest High Point University Poll, more United States residents (28%) and North Carolinians (23%) chose pumpkin pie as their favorite pie to eat during the holidays than any other type of pie.
This is the fifth consecutive year pumpkin pie has been in the top spot in North Carolina. This is the first time that the HPU Poll has taken its holiday pie ranking to the national level.
Nationally, popular pies during the holidays include apple (16%), pecan (14%), chocolate (10%), and sweet potato (10%). Less popular pies, chosen as favorites by less than 10% of U.S. respondents, included cherry (5%), blueberry (3%), key lime (3%), strawberry (2%) and peach (1%).
Other popular pies during the holidays in North Carolina include pecan (17%), apple (17%) and sweet potato (16%). Less popular pies, chosen as favorites by less than 10% of North Carolinians, included chocolate (7%), key lime (5%), cherry (4%), peach (3%), blueberry (2%) and strawberry (2%).
Previous HPU Polls found pumpkin pie to be the holiday favorite in 2021, 2022, 2023 and 2024. Pecan pie was named the second-most popular pie by North Carolinians during that same span and now appears to be tied with apple.
“I know it’s not on the list, but hands down the fan favorite in our family is Grandma’s peanut butter pie,” said Debbi Brock, associate professor of entrepreneurship in HPU’s David S. Congdon School of Entrepreneurship.
United States Residents – Favorite Type of Holiday Pie (November 2025)
What is your favorite type of pie to eat during the holidays?
Pumpkin pie – 28%
Apple pie – 16%
Pecan pie – 14%
Sweet potato pie – 10%
Chocolate pie – 10%
Cherry pie – 5%
Key lime – 3%
Blueberry pie – 3%
Strawberry pie – 2%
Peach pie – 1%
Other – 4%
Unsure – 2%
North Carolina Residents – Favorite Type of Holiday Pie (November 2025)
What is your favorite type of pie to eat during the holidays?
Pumpkin pie – 23%
Pecan pie – 17%
Apple pie – 17%
Sweet potato pie – 16%
Chocolate pie – 7%
Key lime – 5%
Cherry pie – 4%
Peach pie – 3%
Blueberry pie – 2%
Strawberry pie – 2%
Other – 4%
Unsure – 2%
HPU Poll 115 was fielded by the High Point University Survey Research Center on Nov. 11 through Nov. 17 as an online survey using a panel of respondents recruited and maintained by Dynata.
HPU Poll 116 was also fielded by the High Point University Survey Research Center on Nov. 10 through Nov. 14 as an online survey using a panel of respondents recruited and maintained by Dynata.
For both polls, Dynata sent invitations to its panels of respondents (HPU Poll 115 = North Carolina respondents, HPU Poll 116 = U.S. respondents) and the SRC collected the responses on its Qualtrics platform (HPU Poll 115 n = 1001, HPU Poll 116 n = 1004). The SRC did all data analysis. The online samples are from panels of respondents, and their participation does not adhere to usual assumptions associated with random selection. Therefore, it is not appropriate to assign a classic margin of sampling error for the results of HPU Poll 115 and HPU Poll 116. In this case for HPU Poll 115, the SRC provides a credibility interval of plus or minus 3.2 percentage points to account for a traditional 95% confidence interval for the estimates (plus or minus 3.1 percentage points) and a design effect of 1.04 (based on the weighting). For HPU Poll 116, the SRC provides a credibility interval of plus or minus 3.1 percentage points to account for a traditional 95% confidence interval for the estimates and a design effect of 1.01 (based on the weighting). The data is weighted toward population estimates for age, gender, race, and ethnicity based on U.S. Census numbers for the United States and North Carolina, respectively. Factors such as question wording and other methodological choices in conducting survey research can introduce additional errors into the findings of opinion polls. Percentages may not add to 100 because of rounding.
Further results and methodological details from the most recent survey and past surveys can be found at the Survey Research Center website. Materials online include past press releases as well as memos summarizing the findings (including approval ratings) for each poll since 2010.
The HPU Poll reports methodological details in accordance with the standards set out by AAPOR’s Transparency Initiative, and the HPU Survey Research Center is a Charter Member of the Initiative.
Dr. Martin Kifer, chair and professor of political science, serves as the director of the HPU Poll.
Dr. J.R. Moller serves as the staff director of the HPU Poll for the Survey Research Center.