
HPU Poll 126: Majority of North Carolina Voters Say Country Headed in Wrong Direction
HIGH POINT, N.C., Aug. 21, 2026 – A new High Point University Poll of North Carolina likely voters found that a majority (59%) said the country is on the wrong track, while 36% said that the country was headed in the right direction.
More than one-third of likely voters (35%) said the state of North Carolina was headed in the right direction, while 48% said it was on the wrong track.
The poll found 47% of likely voters said they would vote for Anita Earls (Democrat) in the 2026 North Carolina Supreme Court race and 44% said they would vote for Sarah Stevens (Republican).
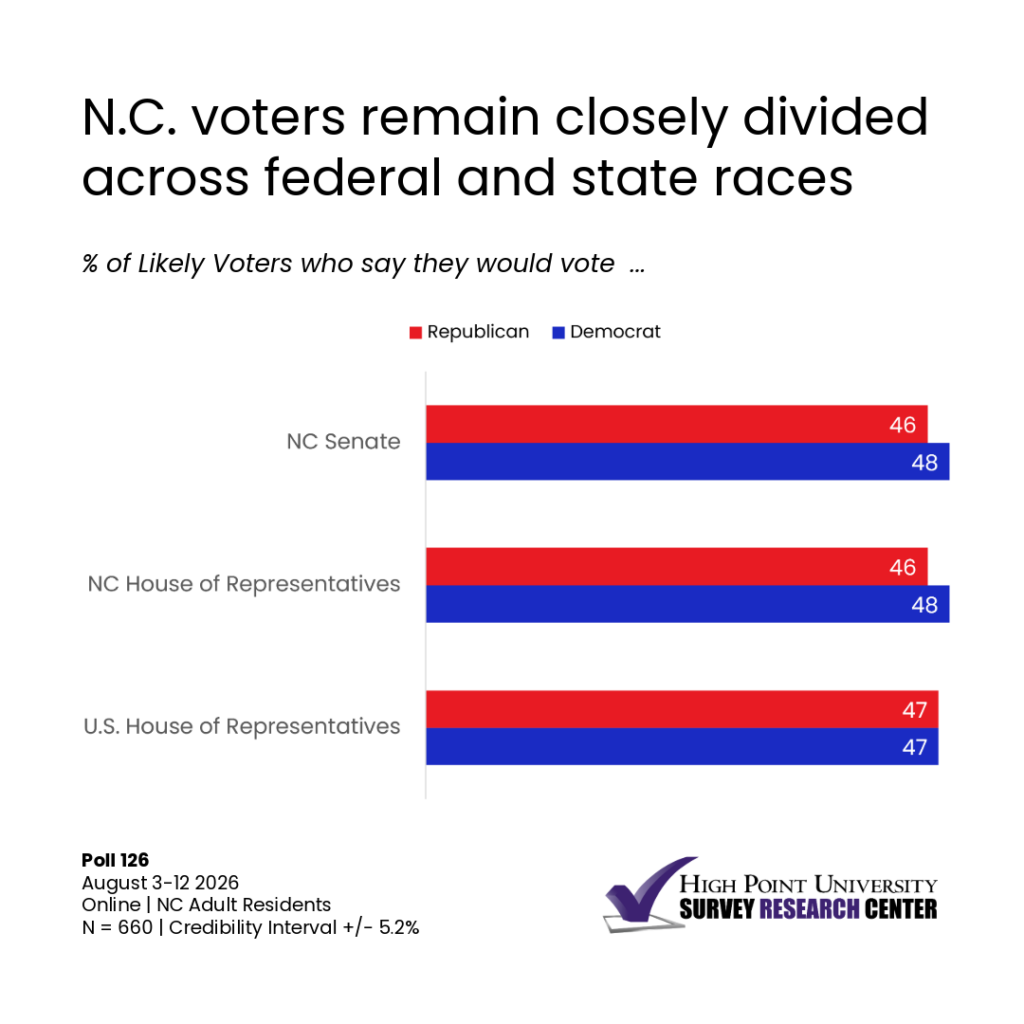
For the U.S. House of Representatives generic ballot, likely voters were evenly divided, with 47% saying they would vote for the Democratic candidate and 47% saying they would vote for the Republican candidate for U.S. House races in North Carolina.
The election for the North Carolina Senate showed a similar pattern. Nearly half of North Carolina likely voters (48%) selected the Democratic candidate and 46% selected the Republican candidate.
In the same poll, likely voters gave Governor Josh Stein a job approval rating of 52%, with 25% expressing disapproval and nearly a quarter (24%) not expressing an opinion either way.
The poll asked these North Carolina likely voters to provide their opinions on the job President Trump has done in handling a variety of issues. His highest approval ratings were for securing the U.S. southern border (52%), law enforcement (51%) and protecting American workers (49%).
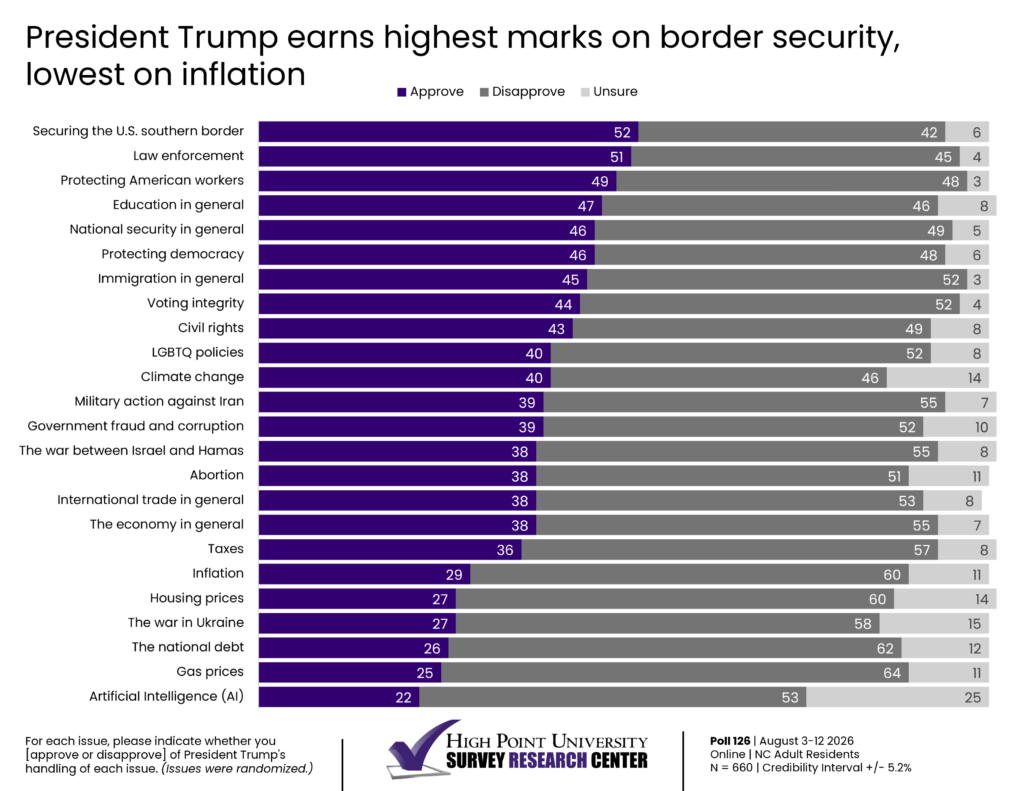
Four in 10 likely voters approved of President Trump’s handling of climate change (40%) and LGBTQ policies (40%). Slightly smaller proportions approved of his handling of military action against Iran (39%), government fraud and corruption (39%), the war between Israel and Hamas (38%), abortion (38%), international trade in general (38%) and the economy in general (38%).
President Trump’s approval ratings on taxes (36%), inflation (29%), housing prices (27%), the war in Ukraine (27%), the national debt (26%), gas prices (25%) and artificial intelligence (22%) were among the lowest recorded.
When asked if they approved or disapproved of the way the U.S. Supreme Court is handling its job, 36% of likely voters indicated they approved, while 45% disapproved.
About two in 10 likely voters approved (22%) of the way the U.S. Congress is handling its job, and 65% said they disapproved.
Question wordings:
North Carolina Likely Voters – Country Direction (August 2026)
Do you think things in this country are [generally going in the right direction or do you feel things have gotten pretty seriously off on the wrong track]?
Right direction – 36%
Wrong track – 59%
Unsure – 5%
North Carolina Likely Voters – State Direction (August 2026)
Do you think things in North Carolina are [generally going in the right direction or do you feel things have gotten pretty seriously off on the wrong track]?
Right direction – 35%
Wrong track – 48%
Unsure – 17%
North Carolina Likely Voters – U.S. Senate Election (August 2026)
If the election for U.S. Senator were being held today, who would you vote for?
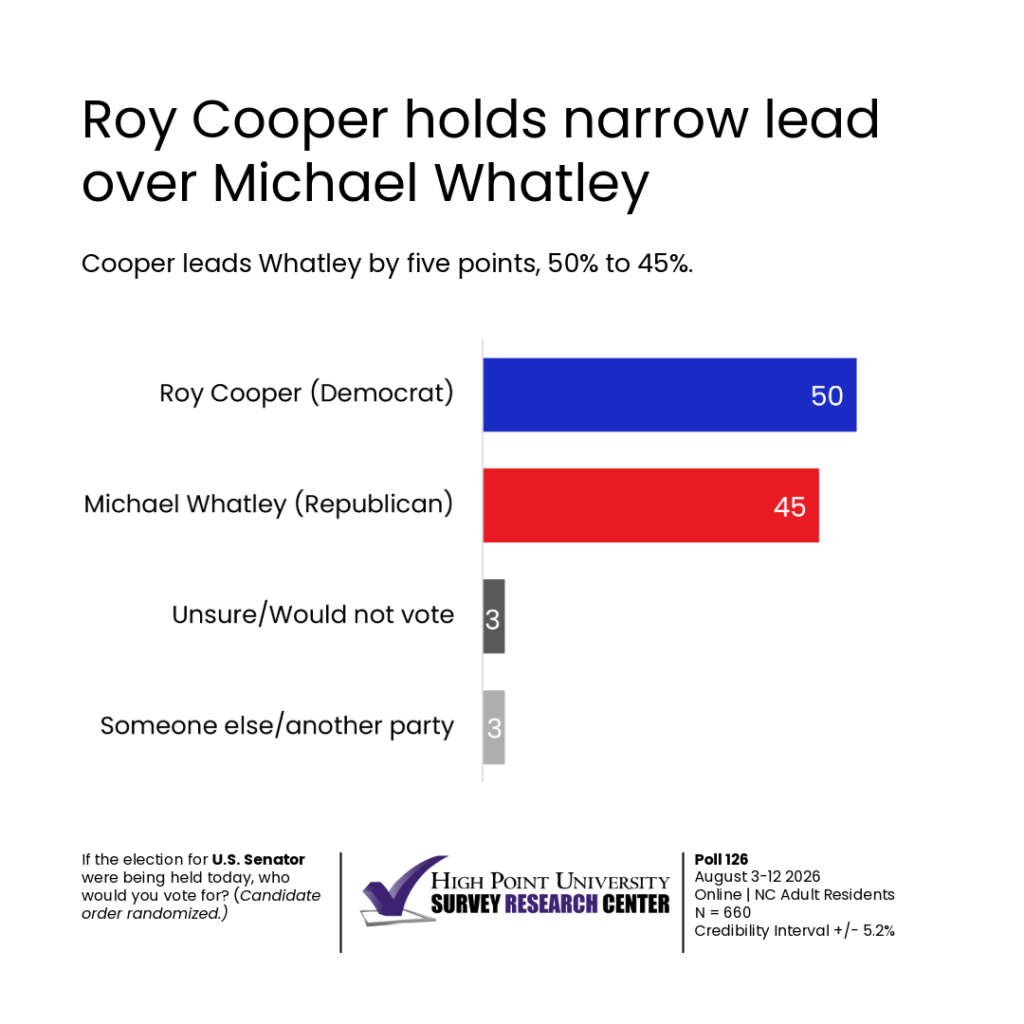
Roy Cooper (Democrat) – 50%
Michael Whatley (Republican) – 45%
Someone else/another party – 3%
Unsure/Would not vote – 3%
North Carolina Likely Voters – North Carolina Supreme Court Election (August 2026)
If the election for North Carolina Supreme Court were being held today, who would you vote for?
Anita Earls (Democrat) – 47%
Sarah Stevens (Republican) – 44%
Someone else/another party – 1%
Unsure/Would not vote – 8%
North Carolina Likely Voters – U.S. House of Representatives Generic Ballot (August 2026)
If the elections for U.S. House of Representatives were being held today, would you vote for [the Republican Party’s candidate or Democratic Party’s candidate] for U.S. House of Representatives in your district?
Democrat – 47%
Republican – 47%
Someone else/another party – 1%
Unsure/Would not vote – 5%
North Carolina Likely Voters – North Carolina House of Representatives Generic Ballot (August 2026)
If the election for North Carolina House of Representatives in Raleigh were being held today, would you vote for [the Republican Party’s candidate or the Democratic Party’s candidate] for North Carolina House in your district?
Democrat – 48%
Republican – 46%
Someone else/another party – 1%
Unsure/Would not vote – 6%
North Carolina Likely Voters – North Carolina Senate Generic Ballot (August 2026)
If the election for North Carolina Senate in Raleigh were being held today, would you vote for [the Republican Party’s candidate or the Democratic Party’s candidate] for North Carolina Senate in your district?
Democrat – 48%
Republican – 46%
Someone else/another party – 1%
Unsure/Would not vote – 5%
North Carolina Likely Voters – Presidential Approval (August 2026)
Do you [approve or disapprove] of the way Donald Trump is handling his job as president?
Approve – 42%
Disapprove – 54%
Unsure – 4%
North Carolina Likely Voters – Gov. Stein Approval (August 2026)
Do you [approve or disapprove] of the way Josh Stein is handling his job as Governor?
Approve – 52%
Disapprove – 25%
Unsure – 23%
North Carolina Likely Voters – U.S. Supreme Court Approval (August 2026)
Do you [approve or disapprove] of the way that the United States Supreme Court is handling its job?
Approve – 36%
Disapprove – 45%
Unsure – 19%
North Carolina Likely Voters – U.S. Congress Approval (August 2026)
Do you [approve or disapprove] of the way that the U.S. Congress is handling its job?
Approve – 22%
Disapprove – 65%
Unsure – 13%
North Carolina Likely Voters – Donald Trump Issues Approval (August 2026)
Below is a list of issues that President Trump has to deal with. For each issue, please indicate whether you [approve or disapprove] of President Trump’s handling of each issue. (Respondents received a randomly selected list of 12 of the following issues presented in randomized order.)
| Approve | Disapprove | Unsure | ||
| Securing the U.S. southern border | 52% | 42% | 6% | |
| Law enforcement | 51% | 45% | 4% | |
| Protecting American workers | 49% | 48% | 3% | |
| Education in general | 47% | 46% | 8% | |
| National security in general | 46% | 49% | 5% | |
| Protecting democracy | 46% | 48% | 6% | |
| Immigration in general | 45% | 52% | 3% | |
| Voting integrity | 44% | 52% | 4% | |
| Civil rights | 43% | 49% | 8% | |
| Climate change | 40% | 46% | 14% | |
| LGBTQ policies | 40% | 52% | 8% | |
| Military action against Iran | 39% | 55% | 7% | |
| Government fraud and corruption | 39% | 52% | 10% | |
| The war between Israel and Hamas | 38% | 55% | 8% | |
| Abortion | 38% | 51% | 11% | |
| International trade in general | 38% | 53% | 8% | |
| The economy in general | 38% | 55% | 7% | |
| Taxes | 36% | 57% | 8% | |
| Inflation | 29% | 60% | 11% | |
| Housing prices | 27% | 60% | 14% | |
| The war in Ukraine | 27% | 58% | 15% | |
| The national debt | 26% | 62% | 12% | |
| Gas prices | 25% | 64% | 11% | |
| Artificial Intelligence (AI) | 22% | 53% | 25% |
Methodology
HPU Poll 126 was fielded by YouGov on behalf of the High Point University Survey Research Center from Aug. 3 through Aug. 12, as an online survey using a panel of respondents recruited and maintained by YouGov. YouGov interviewed 819 North Carolina registered voters who were then matched down to a sample of 800 to produce the final dataset. All respondents indicated that they are registered voters.
Likely voters (n = 660) were calculated based on seven factors. Respondents received one point for responding to each of seven questions in ways associated with a higher likelihood of voting. The questions asked whether respondents voted in the 2024 general election; how much thought they had given to the upcoming presidential election; how much thought they had given to the upcoming U.S. Senate election; whether they knew where people in their neighborhood go to vote; how often they vote; whether they plan to vote in the election this November; and how they rated their chances of voting in November’s U.S. Senate election on a scale from 1 to 10. Self-identified registered voters who scored 5, 6 or 7 on the seven-item index were considered likely voters. All screening questions are reported in the memo accompanying this release: https://www.highpoint.edu/src/hpupoll/.
The HPU Survey Research Center drafted the survey instrument, which was approved by the HPU Institutional Review Board. Interviews were collected through YouGov’s proprietary online survey software, and YouGov invited online panel respondents. The SRC did all data analysis.
The online sample is from a panel of respondents, and their participation does not adhere to usual assumptions associated with random selection. Therefore, it is not appropriate to assign a classic margin of sampling error for the results. The poll interviewed a total of 800 North Carolina registered voters. In this case, the SRC provides a credibility interval of plus or minus 4.3 percentage points for the self-identified registered voter sample (n = 800) to account for a traditional 95% confidence interval for the estimates (plus or minus 3.5 percentage points) and a design effect of 1.57 (based on the weighting). For the likely voters (n = 660), that credibility interval is plus or minus 5.2 percentage points to account for a traditional 95% confidence interval for the estimates (plus or minus 3.8 percentage points) and a design effect of 1.86 (based on the weighting).
YouGov matched respondents to a sampling frame on gender, age, race and education. The frame was constructed by stratified sampling from the 2024 Current Population Survey (CPS) sample with selection within strata by weighted sampling with replacements using the person weights on the public use file.
The matched cases were weighted to the sampling frame using propensity scores. The matched cases and the frame were combined, and a logistic regression was estimated for inclusion in the frame. The propensity score function included age, gender, race/ethnicity, years of education and home ownership. The propensity scores were grouped into deciles of the estimated propensity score in the frame and post-stratified according to these deciles.
The weights were then ranked along 2024 presidential vote choice and ranked on the demographics of gender, age (four categories), race (four categories) and education (four categories) to produce the final weight.
These credibility intervals are attempts to estimate error from the nature of the sample. Factors such as question wording and other methodological choices in conducting survey research can introduce additional errors into the findings of opinion polls. Percentages may not add to 100 due to rounding.
Further results and methodological details from the most recent survey and past surveys can be found at the Survey Research Center website (https://www.highpoint.edu/src/hpupoll/ ). Materials online include past press releases as well as memos summarizing the findings for each poll since 2010.
The HPU Poll reports methodological details in accordance with the standards set out by AAPOR’s Transparency Initiative, and the HPU Survey Research Center is a Charter Member of the Initiative.
Dr. Martin Kifer, chair and professor of political science, serves as the executive director of the HPU Poll for the Survey Research Center. Dr. J.R. Moller serves as the staff director of the HPU Poll for the Survey Research Center. Tiffany Medford serves as a program coordinator for the Survey Research Center.