Gender of Students From The Graduating Class:
| Academic Year: | 2023-2024 | 2024-2025 |
|---|---|---|
| Male (A) | 0 | 4 |
| Female (B) | 6 | 6 |
| Unknown/Not Reported Graduate Gender (C) | 0 | 0 |
| Other Gender Identity (D) | 0 | 0 |
| Total | 6 | 10 |
Breakdown Of All Graduates In The Reporting Categories Below:
| Academic Year: | 2023-2024 | 2024-2025 |
|---|---|---|
| Hispanic Graduates (A) | 0 | 0 |
| Non-Hispanic Graduates (B) | 6 | 10 |
| Unknown/Not Reported Graduates (C) | 0 | 0 |
The Count Of Non-Hispanic Graduates Defined By The Following Segmentations:
| Academic Year: | 2023-2024 | 2024-2025 |
|---|---|---|
| American Indian or Alaska Native | 0 | 0 |
| Asian | 0 | 0 |
| Black or African-American | 4 | 4 |
| Native Hawaiian or Other Pacific Islander | 0 | 0 |
| White or Caucasian | 2 | 6 |
| Two or more races | 0 | 0 |
| Total | 6 | 10 |
| Unknown/Not Reported graduates | 0 | 0 |
| Total Graduating | 6 | 10 |
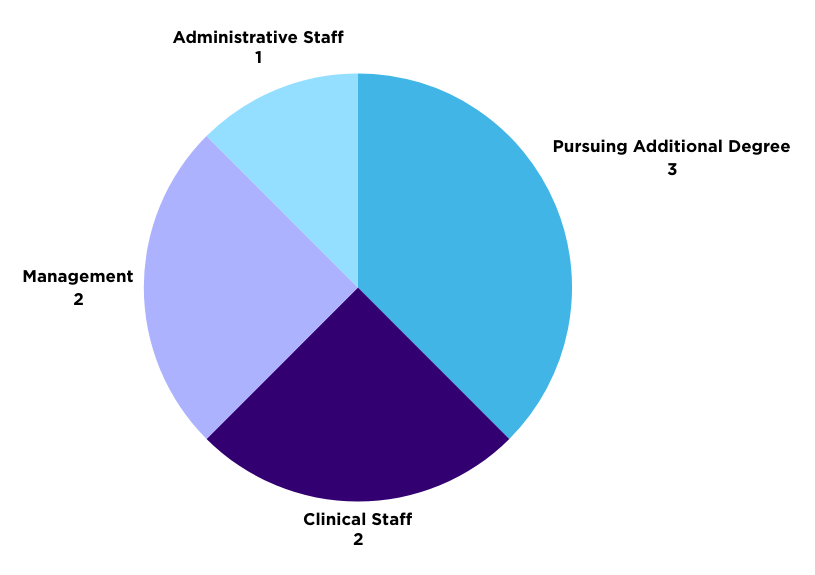
Post-Graduation Employment Summary 2024-2025
- 3 Pursuing additional degree
- 2 Clinical Staff (RN and Behavior Tech)
- 2 Management (Director of Dev., Workforce Dev Director)
- 1 Administrative Staff (Software Training)
Post Graduate Employment Summary:
| Positions By Type | 2023-2024 | 2024-2025 |
|---|---|---|
| Executive Office | ||
| Other Exec. Management | ||
| Management | 2 (Director of Dev., Workforce Dev Director) | |
| Administrative Staff | 1 (Software Training) | |
| Clinical Staff | 2 (PT Tech. and Nurse Tech.) | 2 (RN and Behavior Tech.) |
| Physician | ||
| Educator/Faculty Member | ||
| Fellow/Intern | ||
| Other | 4 (Pursuing additional degree) | 3 (Pursuing additional degree) |
| Unknown | ||
| Not Placed | 2 | |
| Total | 6 | 10 |
Percent Of Students Who Completed Study In The Program In The Expected Time And Who Continued In The Program:
| Academic Year: | 2023-2024 |
|---|---|
| The median (50th percentile), in months, to complete the program of study. | 13.5 |
| The 80th percentile, in months, to complete the program of study | 16.33 |
| The difference between the median (50th percentile and the 80th percentile) as it relates to the program’s mission. | 21 |
| Description (for this academic year 2023 - 2024) : | Fall of the first year offered less courses, variability is also due to difference of # of courses students were willing to take. |
Retention Rate:
The number of students that continued enrollment past the first semester.
| Academic Year: | 2023-2024 |
|---|---|
| Number of students enrolled in second semester who were also enrolled in first semester (A) | 15 |
| Number of students enrolled in first semester (B) | 23 |
| Total: | 65% |
Between the beginning of Fall Term 1, 2023 and the end of Summer Term 2, 2024 we had six graduates, one student transferred to the MBA program, and another student has temporarily withdrawn and will return in Summer Term 2, 2025.
Graduated Student Satisfaction
Numbers or responses are based on a 37.5% response rate from graduates
| On a scale of 0 to 10, how likely are you to recommend your program to a friend or an acquaintance looking to advance their careers in healthcare? | Number of Respondents | Percentage of Respondents |
|---|---|---|
| 7 | 1 | 16.67% |
| 9 | 1 | 16.67% |
| 10 Extremely Likely | 4 | 66.67% |
| How satisfied are you with your program of study? | Number of Respondents | Percentage of Respondents |
|---|---|---|
| Satisfied | 1 | 16.67% |
| Very Satisfied | 5 | 83.33% |
| All things being equal, if you had to do it all over again, would you choose to go to your program? | Number of Respondents | Percentage of Respondents |
|---|---|---|
| Yes | 6 | 100.00% |