Gender of Students From The Graduating Class:
| Academic Year: | 2023-2024 | 2024-2025 | 2025-2026 |
|---|---|---|---|
| Male (A) | 0 | 5 | 1 |
| Female (B) | 6 | 6 | 4 |
| Unknown/Not Reported Graduate Gender (C) | 0 | 0 | 0 |
| Other Gender Identity (D) | 0 | 0 | 0 |
| Total | 6 | 11 | 5 |
The Count Of Graduates:
| Academic Year: | 2023-2024 | 2024-2025 | 2025-2026 |
|---|---|---|---|
| American Indian or Alaska Native | 0 | 0 | 0 |
| Asian | 0 | 0 | 0 |
| Black or African-American | 4 | 5 | 1 |
| Native Hawaiian or Other Pacific Islander | 0 | 0 | 0 |
| Hispanic | 0 | 0 | 1 |
| White or Caucasian | 2 | 6 | 3 |
| Two or more races | 0 | 0 | 0 |
| Unknown/Not Reported graduates | 0 | 0 | 0 |
| Total Graduating | 6 | 11 | 5 |
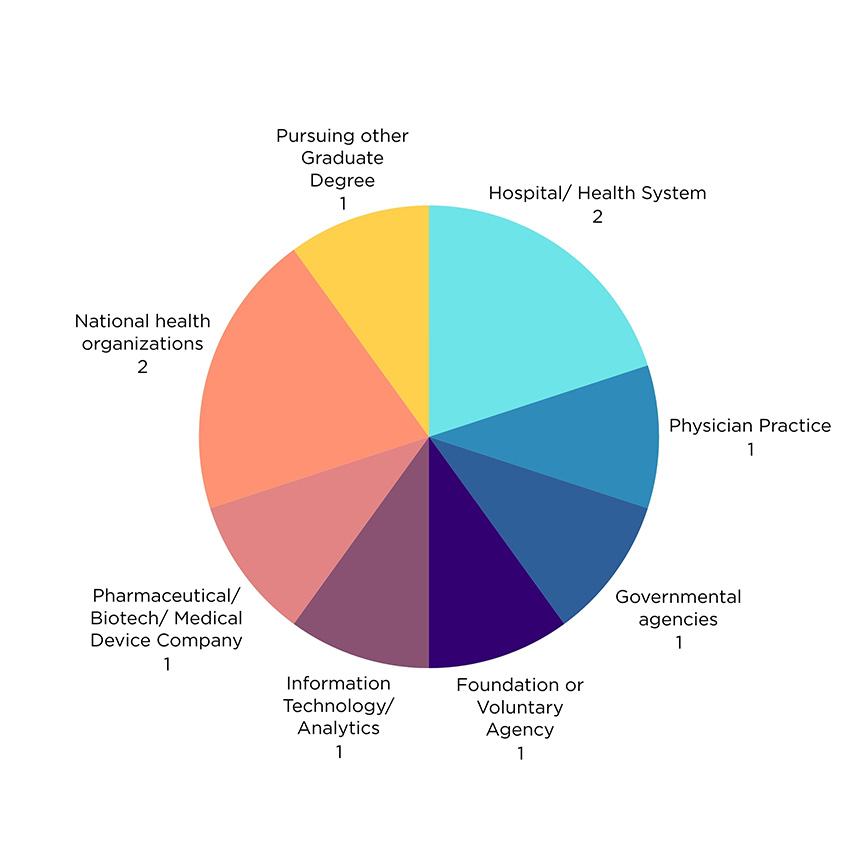
Post-Graduation Employment Summary 2024-2025
- 1 Pursuing additional degree
- 2 Hospital/Health System
- 1 Physician Practice
- 1 Governmental agencies (i.e., local, state, & federal agencies)
- 1 Foundation or Voluntary Agency (e.g., RWJ Foundation, Red Cross)
- 1 Information Technology/Analytics
- 1 Pharmaceutical/Biotech/Medical Device Company
- 2 National health organizations (CVS/Aetna, Walgreens, Haven aka Amazon-JP Morgan-Berkshire)
Post Graduate Employment Summary:
| Positions By Type | 2023-2024 | 2024-2025 |
|---|---|---|
| Executive Office | ||
| Other Exec. Management | ||
| Management | 2 (Director of Dev., Workforce Dev Director) | |
| Administrative Staff | 1 (Software Training) | |
| Clinical Staff | 1 (Nurse Tech.) | 5 (Pharmacists, RN, Lab Tech. and Behavior Tech.) |
| Physician | ||
| Educator/Faculty Member | ||
| Fellow/Intern | ||
| Other | 5 (Pursuing additional degree) | 2 (Pursuing additional degree, medical device sales) |
| Unknown | ||
| Not Placed | 1 | |
| Total | 6 | 11 |
Percent Of Students Who Completed Study In The Program In The Expected Time And Who Continued In The Program:
| Academic Year: | 2023-2024 | 2024-2025 | 2025-2026 |
|---|---|---|---|
| The median (50th percentile), in months, to complete the program of study. | 13.5 | 23 | 17** |
| The 80th percentile, in months, to complete the program of study | 16.33 | 28 | 30** |
| The difference between the median (50th percentile and the 80th percentile) as it relates to the program’s mission. | 21 | 21.7% | 76%** |
| Description (for this academic year 2023 - 2024) : | Fall of the first year offered less courses, variability is also due to difference of # of courses students were willing to take. | Graduates consisted of a mixture of students who took a full course-load each semester and students who took 1-2 courses per term due to work or requirements from the PharmD program. | Graduates consisted of a mixture of students who took a full course-load each semester and students who took 1-2 courses per term due to work or requirements from the PharmD program. One student had taken a temporary withdrawal of 12 months. |
Retention Rate:
| Academic Year: | 2023-2024 | 2024-2025 | 2025-2026 |
|---|---|---|---|
| Number of students enrolled in second semester who were also enrolled in first semester (A) | 15 | 15 | 27 |
| Number of students enrolled in first semester (B) | 23 | 24 | |
| Total: | 65% | 63% |
The Placement/Income data:
| Academic Year: | 2023-2024 | 2024-2025 | 2025-2026 |
|---|---|---|---|
| Median Income | $37,440 | $67,500.50 | $100,000 |
| Retention Rate | 65.2% | 62.5% | |
| Placement | 100% | 90% | 75% |
100%
of surveyed graduates would choose the HPU MHA program again
Based on 2025–2026 exit surveys

100%
of surveyed graduates reported being Satisfied or Very Satisfied with their program of study

Note: Combined metrics from Cohort 1 (n=5) and Cohort 2 (n=7).